
There is no secret to a high-performing Adwords account. If you’ve been reading some of my past articles, you would have noticed how I have a nearly-obsessional tendency to emphasize on the importance of relevancy at all levels. It is a key factor which is a necessity to secure the best possible results. I just can’t stress that enough. In today’s article, we’ll explore how to improve your account’s Quality Scores by analysing your current performance and defining which landing pages to create.
To begin with, why is relevancy important?
Well, there are two obvious reasons:
- Reduced cost-per-click
Relevancy, as seen by Google, will directly impact your Quality Scores, which themselves will impact your Ad Rank formula. I suggest you read about and understand Quality Scores and Google’s Ad Rank formula first if you are not familiar with the definition or mechanics of these two metrics.
So essentially, you will pay less per click, reducing your overall cost (or increasing your traffic volume for your same budget). - Increased conversion rate
Improving relevancy influences beyond the keyword-level however. Let’s think about the user for a minute. If someone searches for a specific product, clicks on an ad that is relevant to this product and then lands on a page that is also relevant to that same product, that person will have a great experience throughout and will have a higher chance to convert. Your conversion rate therefore increases. Common sense.
Oh, but hold on! The cost-per-acquisition (CPA) formula is cost divided by the number of conversions.
The two metrics listed above consequently have a direct impact on your account’s return and cost-efficiency. Fantabulous!
How do I improve relevancy?
This can be done through various optimisations at all levels of your account, such as your campaign and adgroup structure, keyword match types, ad copies and landing pages. We will focus on the latter today. For a more detailed list of Quality Score optimisations, I strongly recommend you read this article.
The Quality Score analysis
Okay, so let’s start by exploring your keywords. Note that for this technique to work, you need to have a well-structured account (campaigns and adgroups) with a naming convention which makes sense. Throughout the rest of this article, we’ll look at a recently-created Adwords account for a call centre based in the Philippines, who advertises its services in Australia. I have chosen to look into this account as the number of pages we can send traffic to is very limited, meaning they won’t cater for all the keywords we are advertising on.
Step 1 – Exporting your data
First thing you will need is a CSV export of your keyword-level data. For this, head over to your Google Adwords account, click on the Keywords tab, select the correct date range and make sure the performance columns include Quality Scores. Finally, click on the Download Report button (CSV format).
Step 2 – Creating pivot tables in Excel
- Begin by removing the total rows
- Remove all keywords with 0 impressions. Note that the standard Quality Score is set at 6 and will begin to fluctuate based on performance.
- Select your table
- Click on Insert > Pivot Table
Step 3 – Analyse your campaign-level Quality Scores
-
- Add Campaign as a Row
- Add Quality Scores as a Value
- Change the Quality Score field setting from Sum to Average in the Value Field Settings
-
- Reduce the number of decimals
- Apply a colour scale conditional formatting where green is the highest and red is the lowest
Tada! Now you can easily see the true average Quality Score per campaign, helping you understand which parts of the account may need improvements.
Step 4 – Adding adgroup-level data
-
- Add Adgroup as an additional Row in that same pivot table
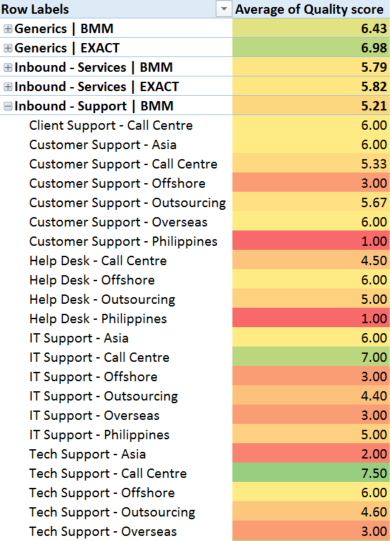
We can begin to identify patterns when it comes to low Quality Scores. In this example, adgroups relating to the Philippines seem to have a much lower Quality Score than other adgroups.
Here’s something to investigate further.
Step 5 – Creating identifiers for in-depth investigation
-
- Return to your original data table
- Add two columns, named Idenfier 1 and Identifier 2
- Split the adgroup names so each identifier is in its own column. Note that this is where your naming convention becomes handy!
In my example, I simply copied the Adgroup names in both column, then did a Find ” – *” and Replace by nothing in Column 1, and Find “* – ” and Replace by nothing in Column 2. You can also use the Text to Columnns functionality in Excel for the same result.
Here is the result:
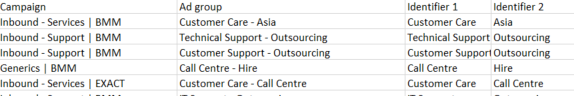
- Now right-click on your Pivot Table and click on Refresh
- You will notice the Idenfier 1 and Identifier 2 fields now show in field selection menu.
- Remove campaigns and adgroups, add the identifiers and voilà!
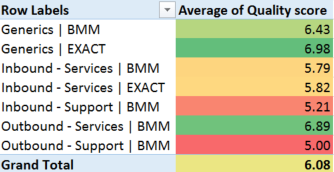
Step 6 – Analysing the results
Here are the results:
Identifer 1
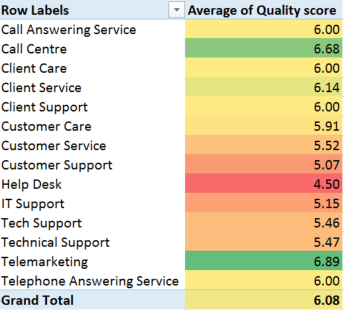
Google seems to understand the landing pages are more relevant to Call Centre, Client Service and Telemarketing.
However, it does not find it relevant to Customer Service, IT and Technical Support.
Identifier 2
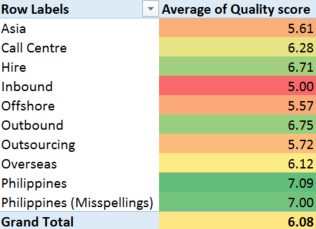
Following the same approach, Google seems to understand the relevancy with Philippines, Overseas and Hire.
However it does not see the relevancy between Asia, Outsourcing and Offshore.
Conclusions
Looking at average Quality Scores at either campaign or adgroup levels only deliver part of the answer. To fully understand which keyword themes Google seem to recognise on your landing page, you need to dig a little deeper. The above technique does exactly this, it allows you to see beyond the initial data.
If you remember, we identified in Step 4 that some Philippines-related adgroups seemed to be under-performing.
Looking at data from this new angle, we can clearly see that Philippines was not the issue (average Quality Score > 7), but Customer Support (Avg. QS 5.07) and Help Desk (Avg. QS 4.5) were actually the culprits, bringing the overall Quality Scores down.
The next step for this account is to create landing pages that focus on these low-performing keyword themes and start driving traffic there. While keeping a close eye on performance evolution is mandatory, the same in-depth analysis should be repeated in 4-6 weeks (depending on traffic volume) after the destination URLs have been updated to ensure Quality Scores, cost-per-click and conversion rates have all improved.